






Information icon

We are experiencing some disruptions to our telephone services and are working to resolve this as quickly as possible. Member Online and our mobile app services are still available here

Skip to main content
Join

Balanced
(MySuper)

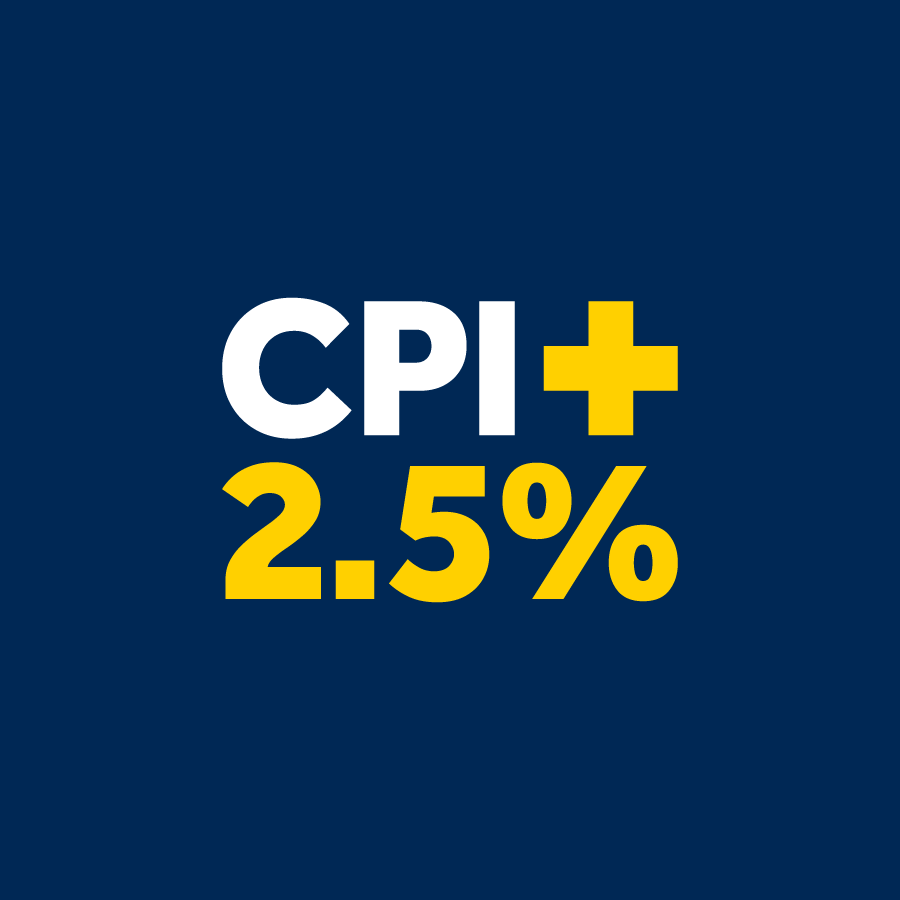
The Balanced investment option is focused on delivering the best net return from investing in a portfolio that has a bias to growth assets.

sunset and sea behind, Michigan

* Investment costs are based on estimated and actual information from the previous financial year. The costs payable in future years may be higher or lower. Administration and other fees also apply. For a full breakdown of fees and costs, see the Fees and Costs Guide for your product.
^ Investment return over 10 years to 30 September 2026, net of investment fees and costs. Administration and other costs apply. Returns won’t display for options younger than 10 years. See our investment returns page for returns over all available periods.

Head to Member Online to choose the investment option that’s right for you.

Past

Performance

Accumulation

This table shows the 12-month net return for our Balanced option at 30 June each year. The net return is the money the investment has earned, minus investment costs and taxes.1

Year20212022202320242025
Return 21.32%1.57%8.00%7.60%10.81%

This table shows the average net return for our Balanced option over 3, 5 and 10 years to 30 June 2025.1

Year3 years5 years10 years
Average return (p.a.) 8.79% 9.67% 8.32% 

1. Administration and other fees also apply. For a full breakdown of fees and costs, see our Fees and Costs Guide for your product. Past performance is not a reliable indicator of future performance and should never be the sole factor considered when selecting a superannuation fund.


Ready to join? Online applications only take five minutes.

Or call us on 1300 467 875 8am – 8pm (AEST/AEDT), Monday to Friday. 


Investment details

Introduced on 28th November 2022

Account type
Return target
Net Return^
Recommended timeframe
Total investment fees & costs*
Estimated number of negative annual returns, over any 20 year period

Who is this option suited for?

Risk Profile

An investment’s risk level reflects how likely it is to return a different outcome than what’s expected. We assess risk based on the Standard Risk measure.

Asset allocation mix

Growth
Defensive

These figures describe how the option is invested between growth assets (Higher risk / higher return, like shares) and defensive assets (Lower risk / lower return, like cash).

Award and Ratings

testing

It is a long established fact that a reader will be distracted by the readable content of a page when looking at its layout. The point of using Lorem Ipsum is that it has a more-or-less normal distribution of letters, as opposed to using 'Content here, content here', making it look like readable English.

Past performance

Annual returns at June 30 of year

Past performance chart. Use arrow keys to navigate between data points and values.
Our target asset mix chart. Use arrow keys to navigate between data points and values.

 ^ Investment return over 10 years to ${0} , net of investment fees and costs. Administration and other costs apply. Returns won’t display for options younger than 10 years. See the investment returns page for returns over all available periods.

* Investment costs are based on estimated and actual information from the previous financial year. The costs payable in future years may be higher or lower. Administration and other fees also apply. For a full breakdown of fees and costs, see our fees and costs page or Section 6 of the Member Guide.


This is a dialog window. Press Escape to close the dialog.